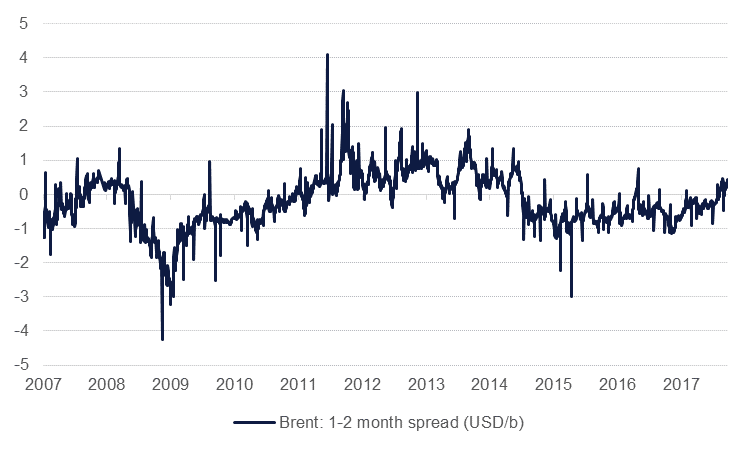
OPEC officials are sounding off in increasingly positive tones about the effectiveness of their supply cuts in shrinking global inventories and getting them closer to five-year averages. This shift in messaging is helping push markets in a supportive direction and short-term data points do indeed support the narrative. The front end of the Brent curve has settled into backwardation with the most confidence in three years: the 1-2 month spread has held in backwardation since early August, its longest run in the current oil price cycle.

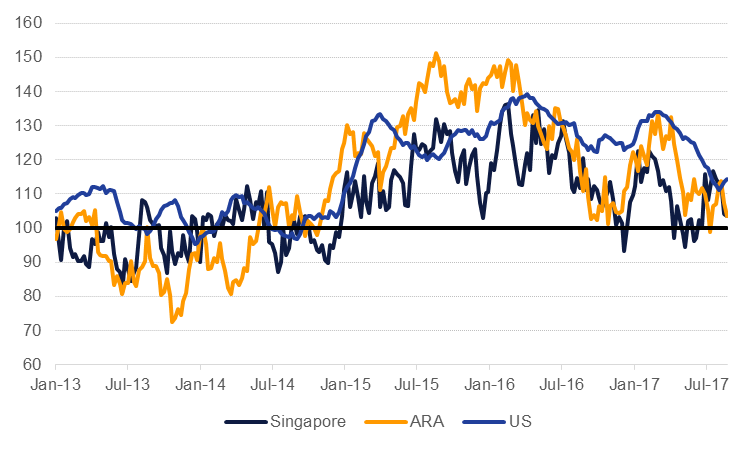
Transparent inventory data is also showing stocks in major centres (ARA, Singapore and US) all converging on their five-year averages. OECD stocks are generally accepted to be a lagging indicator in any oil market rebalancing as physical participants draw expensive floating storage down first as carry trades become uneconomic in a backwardated market. Whether in ARA, Singapore or the US the ratio of current inventories against their five-year average (ie, a measure of the ‘excess inventory’) is narrowing although in all markets they have still been greater than 100% on average for the first nine months of the year.

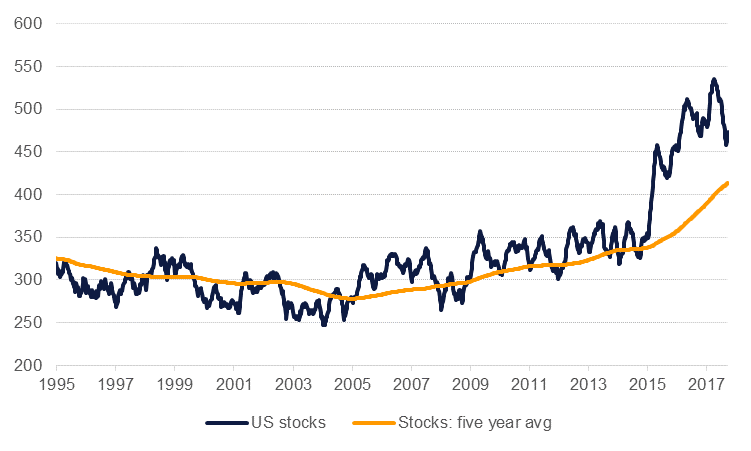
What a myopic focus on converging on five-year averages ignores, however, is the fact that long-term average inventory levels (for crude and products) have all increased substantially since the end of 2014. In the US, five-year average inventories are now 22% higher than they were at the end of 2014 while in ARA the increase in product stocks has been nearly 16%. The most recent data out from the EIA has total commercial crude stocks of over 472m bbl with a five year average of over 410m bbl. At the end of 2014, stocks were 353m bbl and their five-year average was less than 340m bbl. On a first glance, then, OPEC is nearing its target of shrinking the overhang in inventories but the task is being made easier thanks to the benchmark moving closer.

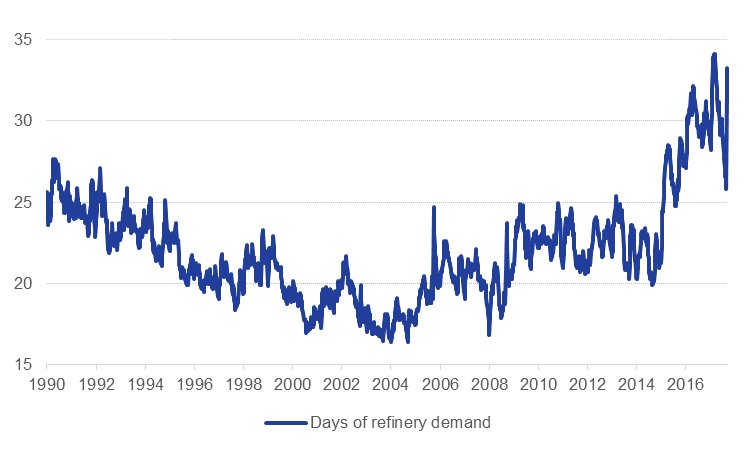
As a way to assess a tightening market we feel using the five-year average is misleading. It also neglects to show how well stocks are able to meet demand, rather than only act as a residual for supply flows. Using EIA data, which we acknowledge is highly US-centric but nevertheless has a large bearing on futures price movements, current levels of US commercial crude stocks are at unprecedented levels when measured against refinery crude demand. There is roughly an extra month’s worth of demand stored in US inventories which helps to diminish the impact of one-off factors such as hurricanes or spikes in geopolitical risk.
Refinery intake has grown as the US economy recovered from the 2008-09 financial crisis, implying that stocks would have needed to track higher in any case but the scale of increase has more than swamped current demand conditions. US refinery demand has increased 16% between August 2008 and August 2017 while the increase in US crude production has been closer to 90%.
There are parts of the barrel where market tightness is more pronounced—US distillates and fuel oil in particular—and prices could sustain higher levels. Gasoil cracks over Brent, for example, spiked when Hurricane Harvey hit the US but were already on an upward trend prior to the storms and long-term averages there have been declining.

For crude markets, though, declaring victory can be all too tempting when goal posts are in your favour. OPEC’s cuts have helped to make the crude market less bloated but we don’t believe that they have shifted it to a degree that would allow prices to rally and sustain levels substantially higher than current levels. We maintain our forecast for Brent futures to average USD 51.50/b in Q4 and similar levels for 2018 as a whole.