Recent Search
Popular Searches

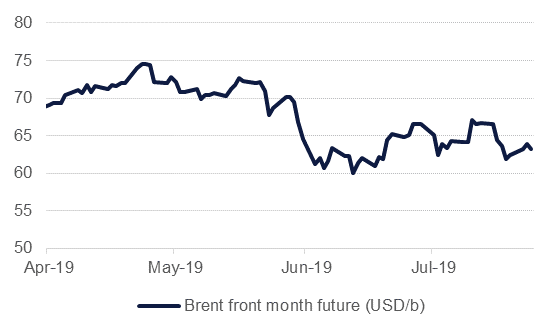
The escalation of geopolitical tension in the Middle East has raised market anxiety over the security of crude oil flows from the region. The chokepoint is vital for flows of crude and products and the EIA has estimated that as much as a fifth of total crude and products consumed globally passes through the waterway. Any threat to the clearance of the Strait should thus be notionally supportive for crude oil prices but since the first attacks on tankers in the port of Fujairah, Brent prices have risen by only a little more than 3%.
Does this relatively muted gain in prices mean the Strait of Hormuz doesn’t matter? Certainly not given how important it is for the passage of crude and products. But it does suggest that other factors are acting with an equal or greater force in compressing prices or acting as a barrier that geopolitical risk has failed to punch through.
 Source: EIKON, Emirates NBD Research
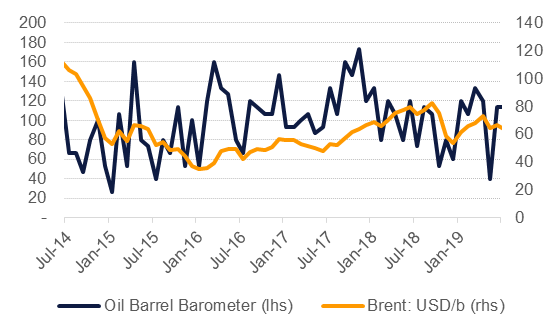
In an effort to assess how direct and measurable fundamentals are in impacting oil prices we have built the Oil Barrel Barometer (OBB) to identify phases when both are moving in complimentary directions. That is, tight fundamentals see prices move higher and vice versa. We have built our OBB based on fundamental and market variables that impact crude prices both in the short run (month to month) and over longer time periods. Among the fundamentals we have included factors such as production levels from OPEC countries, inventory levels in the US and PMI readings from major economies as a demand proxy among others. External variables such as the value of the US dollar index, performance of equity markets and rates feed the OBB with sentiment on risk (higher or lower appetite) while we have also incorporated very long-dated time spreads from crude futures as an indicator of investment and hedging views specific to the oil market.
The variables all have an equal weighting as the market’s evaluation of a given factor appears to us highly capricious. An inventory draw can be as significant as a change in the dollar depending on the week or month, particularly when factors outside the variables we have included in the barometer are setting the tone of financial markets: for instance, uncertainty around Brexit should have little direct impact on crude oil but may trigger much broader moves in currency, rates, equity and, ultimately, oil markets.
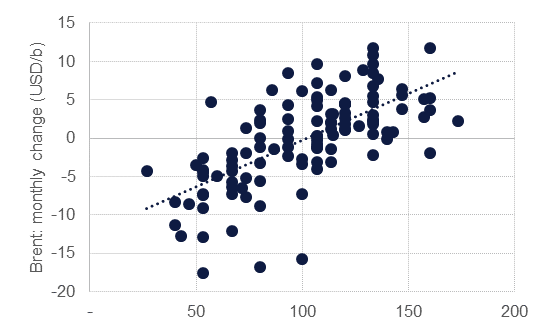
A reading above 100 in the OBB suggests prices should be moving higher month/month while below 100 should support price declines. Over the last 10 years there is a reasonably strong correlation between the OBB and price changes but at this stage, the OBB is agnostic to the scale of the change in price (% change) and seeks to identify whether fundamentals support lower or higher prices. The relationship between the OBB and price changes does appear reasonably strong but the data points that fall far off the trend line (either the top left or bottom right quadrants) remain of interest as they suggest strongly non-fundamental variables acting as the catalyst for price moves and where more short-term analysis can provide clues to explain why prices moved in a specific direction.
 Source: EIKON, Emirates NBD Research
The current reading of 113 supports a positive price move story on a monthly basis as inventories in the US and other major trading hubs are firmly in decline. However, oil markets can be distorted by very short-term one-off factors: the impact of a hurricane disrupting production in the Gulf of Mexico for instance, or an interest rate decision by a central bank distorting financial markets.
 Source: EIKON, Emirates NBD Research.
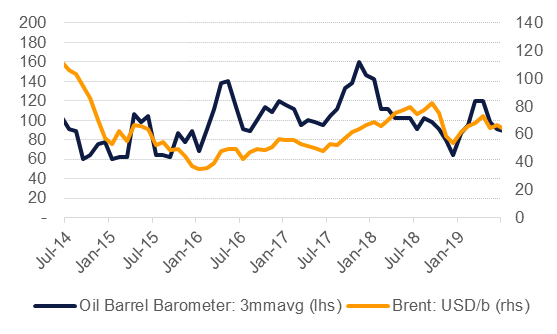
A rolling monthly average helps to strip out some of this ‘noise’ and provides a stronger forward-looking signal. The three-month rolling average at 91 suggests some price declines ahead which correlates with our forecast that oil market balances will return to surplus in the final months of 2019 and lead to lower average prices for Brent in Q4 than the rest of the year.
 Source: EIKON, Emirates NBD Research.
We have restricted our presentation here to display the barometer measured against Brent futures for the sake of brevity but the relationship holds just as strongly for WTI futures.
We don’t intend for the Oil Barrel Barometer to be static and will continue to augment and enhance it with variables we deem important to setting the direction of oil prices. For instance, assessing risk appetite and sentiment in a more consistent manner based on the flow of headlines and market chatter may help give a clue as to why fundamentals may support a move one way only for prices to react in the opposite.