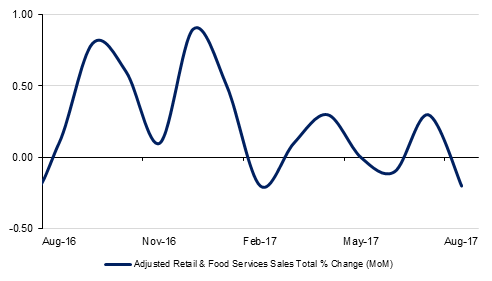
U.S retail sales fell 0.2% m/m in August as Hurricane Harvey likely squeezed motor vehicle purchases, which tumbled 1.6% last month. July U.S. retail sales data was revised downwards reflecting a 0.3% m/m rise against initial estimates for a 0.6% m/m rise. Overall retail sales however increased 3.2% y/y in August, pointing to the underlying strength in consumer demand. Automotive sales could get a boost over the coming months from replacement sales for flood damaged vehicles. Core retail sales which excludes, automobiles, food services, building materials and gasoline fell 0.2% m/m in July. Core retail sales correspond most closely with the consumer spending component of GDP.
U.S industrial production declined 0.9% m/m in July, the first fall in output since January this year, as hurricane Harvey battered oil gas and chemical plants across the U.S Gulf Coast. A cool summer in the east coast sapped utility demand, further depressing August figures. July industrial production data however was revised upwards 0.4% m/m.
U.S consumer prices accelerated in August driven by a rise in the cost of gasoline and rents. The data by the Labour Department on Thursday said its Consumer Price Index rose 0.4% last month after edging 0.1% in July. Gasoline prices surged 6.3 percent, the biggest gain since January, while the cost of rental accommodation surged 0.4 percent. Core CPI, which strips out the volatile food and energy components went up 0.2% in August.
Comments by Bank of England policymaker Gertjan Vlieghe that the “the appropriate time for a rise in Bank Rate might be as early as in the coming months”, sent sterling to its highest level since the result of the Brexit vote last year. The comments coming from Vlieghe, a policymaker who had been its strongest advocate of ultra-low borrowing costs, prompted investors to double down on a rate hike. He pointed to data trends of reducing slack, rising pay pressure, strengthening household spending and robust global growth as supportive factors.
 Source: Emirates NBD Research
Sovereign bonds fell across the developed world as short dated treasuries were rattled by higher than expected inflation data out of the US which raised the prospect of a December rate hike close to 50%. Yields on 2yr, 5yr,10yr and 30yr UST closed the week at 1.38% (+6bps), 1.81% (+10bps), 2.20% (+7bps) and 2.77% (+3bps) respectively. Across the Atlantic, though we remain skeptical if BoE will raise its policy rate in the face of weakening growth and ongoing Brexit uncertainty, futures implied probability reflects more than 57% chance of a rate hike before the end of the year. Yield on 10yr Gilts were up 26bps during the week to 1.30%. Even Bund yields were up 10bps to 0.43%.
Regional GCC bond market moved mostly in tandem with the benchmark yields. Credit spreads reflected resilience even in the face of large new issue supply of over $3.5 billion during the week. CDS levels on GCC sovereigns traded in a tight range with Saudi Arabia, Qatar and Dubai closing at 82bps (-3bps), 90bps (unchanged) and 143bps (+1bp) respectively. Credit spreads on Bloomberg Barclays GCC index tightened four bps to 136bps though total yield widened 3bps to 3.26% during the week as benchmark yield curve shifted upwards.
During the week, Bahrain raised $3 billion after being well oversubscribed for its 7yr, 12 yr and 30 yr tranches that priced at 5.25%, 6.75% and 7.50% respectively. Swapping / flipping activity in the Bahrain curve actually resulted in good bid tone and Bahrain bonds recorded price increases across the curve. The freshly issued BHRAIN 29s debut well in the secondary market with yield tightening a bp and price rising to $100.10.
According to reports, Egypt’s cabinet is expected to approve a plan to sell 1.5bn in EUR-denominated bonds in the next two to three weeks. The notes, which will be Egypt’s first in the EUR, will likely have tenors of five to ten years.
The dollar performed well over the last week, gaining on most of the other major currencies with only GBP and NZD showing a firmer performance. Over the course of the week, the Dollar Index rose 0.54% to 91.844 showing some signs of relief following the large decline of the previous week. However, despite these gains, the index still remains vulnerable. Analysis of the daily candle chart shows that that the strong daily downtrend that has been in effect since January 3 2017 remains firmly intact. In addition, the 200 week moving average (92.69), which previously acted as a support has now acted as a resistance for a second consecutive week, with a second consecutive weekly close below this key level. The last time the index traded below this key level was in May 2014.
With the exception of the Tadawul (+0.4%), all major regional equity indices closed in negative territory. Gains on the Tadawul was led by market heavyweights with Al Rajhi Bank and Sabic adding +1.0% and +0.4% respectively.
Oil prices had their strongest week since July with WTI futures rallying more than 5% and Brent up 3.4%. WTI is holding just below the USD 50/b mark while Brent is nearing in to USD 56/b. Fundamental data out lately has been constructive for oil markets even discounting for the noise surrounding the impact of hurricanes in the US. Inventories in Asia are edging closer to their rolling five-year average, according to data out of Singapore while demand conditions in the US should snap back reasonably quickly from hurricanes.
Market structures are more or less unchanged week on week with Brent’s backwardation around USD 0.20/b at the front of the curve and WTI in a contango near to USD 0.60/b. The 2018 calendar strip for WTI is knocking on USD 52/b, suggesting a positive hedging environment for US producers.