Recent Search
Popular Searches

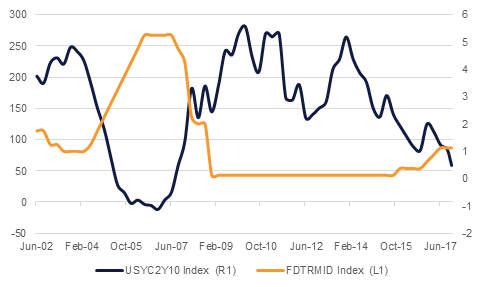
Economic growth in the US is moving at a solid pace and the labor market is at full employment - so why aren’t we in an environment of steeper curve and higher yields? In fact the UST curve has flattened materially with 2yr10yr spread now at 58bps vs 122bps at the beginning of this year.
The recent flattening of the U.S. yield curve is raising concerns that the levels are rapidly approaching a point at which the trend will induce an economic slowdown in the US. While we are of the belief that with the Fed raising interest rates in the face of stubbornly low inflation, it is only natural to see curve flattening, there is no denying that the longer the trend continues, the more likely its effects could spread to bank earnings and the real economy. Also it would limit the Fed’s ability to respond when these risks emerge.
The Federal Reserve is likely to follow through its forecast of three rate hikes this year. The two-year Treasury yield is at the highest level since 2008 as investors prepare for a rate hike in December, and begin to build up expectations for further increases next year. With short-end yields climbing, the curve historically tends to flatten as longer-term rates rise more slowly. But since the start of 2017, 10-year and 30-year yields have actually declined.
Historically curves begin to flatten somewhere at or before the mid-point of any rate hike cycle. In the previous rate hike cycle of 2004 – 2006, 2yr10yr spread was at 190bps at the time of the first rate hike in June 2004 (fed rate rose from 1% to 1.25%). From there on, the curve began to flatten and reached its lowest point in the cycle at -12bps in December 2006. The level similar to the current level of 58bps was reached after four rate hikes equating a total of 200bps in March 2005 and ahead of the remainder five rate hikes equating to 225bps of additional increase.
 Source: Emirates NBD Research
Most market participants ascribe the falling long term yields to stubbornly muted inflation, however, we believe the bigger factor is the unabated relentless demand for treasuries which has led to lower yields on the longer end of the curve. Some of the reasons for the strong demand for treasuries are as follows:
Investors lack alternative safe havens. Gold is illiquid and other safe government papers across the world are largely low yielding. High yielding currencies such as AUD and CAD are also reasonably illiquid for large size investments.
Adoption of Basel III requires banks to hold more of the treasury paper than under the previous regime. With banks across the globe gradually adopting Basel III framework, the bid for treasuries from banks is likely to continue.
Investors don’t believe that the Fed will raise rates too aggressively: Circa 50% of the US treasury debt is directly or indirectly held by US government or government related entities. Investors don’t believe that the Fed will raise rates too aggressively which could affect the financial position of these entities materially. With expectations of tamed Fed and lower number of rate hikes in the future, investors remain confident and comfortable in buying treasuries.
Emerging market sovereigns are beefing up their FX reserves to hedge against external vulnerabilities such as the one faced by the Asian countries in late 90s. Some sovereign such as China and Japan also use USD reserves to protect their currencies and maintain their export competitiveness.
Supply of US treasuries is expected to be low in the coming few years than it has been in the last few years. So with decreasing supply and increasing demand, the technical dynamics for treasury yields are biased towards tightening.
Corporate borrowing patterns are shifting from bank loans to capital markets and this leaves banks with extra cash to be deployed into other securities.
The pools of retirement savings and insurance money are ever increasing as the world population ages and penetration of insurance products deepens. Aging population across the globe is also seeing asset allocation shifting to safer classes thereby increasing allocation to treasuries. Insurance and pension funds that are always seeking duration find longer dated treasuries as the best way to get it. Also influx of fixed income focused ETFs in the recent years is fueling the demand for liquid securities such as the USTs.
 Source: Bloomberg, Emirates NBD Research
Treasury recently announced that it wants to focus increased issuance in bills and shorter-dated coupon maturities, like two- and five-year notes. That creates relative scarcity at the long end of the curve and a premium at the short end to absorb the extra supply.
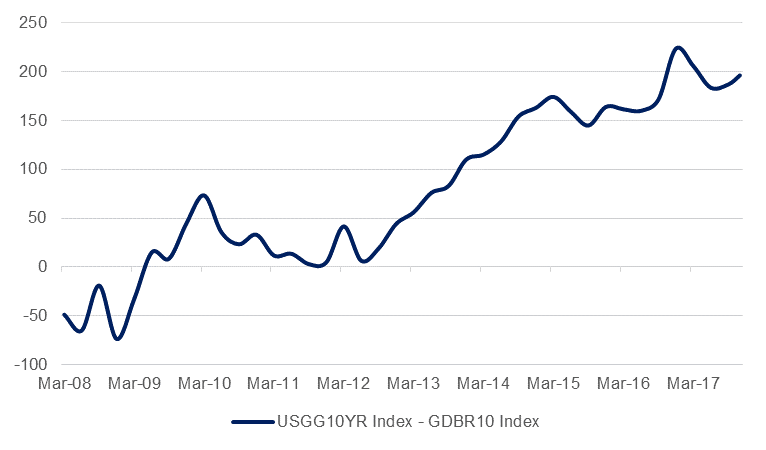
Given the pegged currencies, UST curve movements translate into similar trends for the local currency curves in the GCC region with mild variation and tend to have direct impact on the banks’ operating performance. Banks typically prefer a steeper yield curve because they generate income from the spread between long-dated loans and deposits that are priced on shorter-term rates. Without the gap, their performance suffers. The impact of flattening curve is becoming visible in the share prices of the US banks although actual impact on profitability of the GCC banks is yet to emerge.


