Multiple headwinds have simultaneously been felt by India’s financial markets. The sharp and sustained rise in oil prices, widespread risk aversion to emerging markets and renewed strength in the USD laid bare the pain points for the Indian economy. With domestic political risk rising and global disputes over trade showing no signs of abating, volatility in Indian markets is likely to remain at elevated levels heading into the year end.
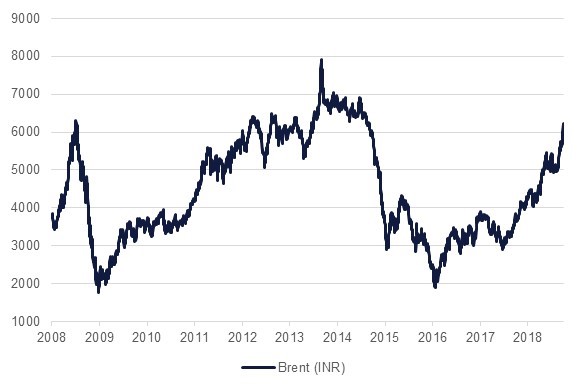
The impact of oil prices on India’s macroeconomic picture is well known given that India imports nearly 80% of its oil needs. The current dynamic of higher oil prices and stronger US dollar (implying weaker INR) has magnified the impact of the same on India’s current account and fiscal deficit. In INR terms, Brent is within 2% of its 2008 high and more importantly 70% higher in the past 12 months to record the steepest annual gain since 1999. The contagion impact on inflation, monetary policy and public expenditure has the potential to derail the pick-up in economic activity and even heighten the political risk.

India’s current account deficit (CAD) is expected to widen to c.3.0% of GDP in FY 2019 compared to earlier expectations of around c.2.0% of GDP. The recent data release showed that CAD widened to 2.4% of GDP (USD 15.8bn) in Q1 FY 2019 from 1.9% of GDP (USD 13.0bn) in Q4 FY 2018 and 2.5% of GDP (USD 15.0bn) in Q1 FY 2018. This along with capital account movements resulted in a deficit of USD 11.3bn in balance of payments. This was the first deficit in the last six quarters and the widest since Q3 FY 2012.
While high electronic imports have replaced declining gold imports, oil imports continue to have a direct impact on trade deficit. Oil imports have contributed nearly 40% of the trade deficit for India in the previous two fiscal years. However, with oil prices rising sharply, the share in trade deficit could rise to as high as 50% especially as demand for oil in India continues to rise and is rather inelastic to price.
The math behind India’s budget for FY 2019 was based on oil at USD 65/bbl and USDINR around 66.0. With both these levels significantly breached, it becomes obvious that it will be difficult for the government to stick to its planned fiscal deficit target of 3.3%.The fuel subsidy bill will increase even after if it is assumed that the government will continue to pass the cost to consumers. Additional pressures for the government comes from lower than expected revenues from GST (Goods & Services Tax) and volatile equity markets weighing on disinvestments. It should also be noted that the capacity of the government to increase GST rates is fairly limited given the tendency to continue to rationalize rates lower. The visible signs of an increase in direct tax collection is unlikely to offset the shortfall in indirect tax collection. Unlike in the past years where the government has resorted to cutting expenditure to rein in deficits, the prospect of them using that route in an election year is highly unlikely.
However, the government has so far remained firm in conveying its intention to stick to its fiscal deficit target. The latest data release by the government showed that at the end of August fiscal deficit touched 94.7% of FY 2019 target. This is marginally better than 96.1% at the same point last year. It also intimated that the gross borrowings for H2 FY 2019 will be INR 24.7tn. This would take the full FY 2019 borrowings to INR 5.35tn, nearly INR 700bn lower than budgeted INR 6.05tn.
The Reserve Bank of India has so far raised repo rate in FY 2019 by 50 bps in two tranches of 25 bps each to 6.50%. While the move was earlier seen as a preemptive move to guard against spike in inflation, it appears that the central bank is now firmly on path to tighten monetary policy. This change in stance is earlier than anticipated and most likely forced by the moves in USD, oil prices and pressure in other emerging markets. We expect the RBI to hike rates by another 50 bps over H2 FY 2019 starting with 25 bps when they meet later this week.
While global factors have played their part, domestic pressures have also had a hand. The CPI for August came in at 3.69% compared to 4.17% in July. However, core inflation (including petrol and diesel) remained elevated at 6% y/y (compared to 6.2% in July). Importantly, the monthly momentum in core inflation remained unchanged at 0.5% m/m. The headline number was helped by benign food prices. With high frequency data pointing to pick up in prices of several components of CPI and retail prices for petrol and diesel touching new highs inflation is expected to pick-up but still remain within the range of 4-6% for FY 2019. In a trend similar to CPI, the wholesale price inflation also eased to 4.53% in August from 5.1% in July. However, core WPI inflation increased to 5.2% from 4.9% in July.
It is also likely that the RBI will use interest rates as a tool to support the INR. We do not expect the central bank to explicitly acknowledge this but given the central bank’s propensity to minimize volatility in the INR, raising rates could be a useful tool. However, the central bank would be wary of the costs if it starts to impinge on early cycle pick-up in growth.
The Q1 FY 2019 GDP and GVA data came in at 8.2% and 8.0% respectively. This was the highest quarterly print in the last nine quarters. The significant improvement was on account of a favorable base effect and sharp pick-up in economic activity. Manufacturing (13.5% versus 9.1% in Q4 FY 2018) and Construction (8.7% versus 11.5% in Q4 FY 2018) sectors drove economic activity. Agriculture sector also remained robust with growth of 5.3% y/y. On the demand side, private consumption rose to its highest level in six quarters at 8.6%.
Since the release of the GDP data, high frequency data has shown some moderation but remain well into expansionary territory. The Nikkei India manufacturing PMI for September came in at 52.2, lower than the high of 53.1 in June 2018. The growth rate in India’s eight core industries also moderated to 4.2% in September from previous month’s high of 7.3%. Also, industrial production in July softened to 6.6% y/y compared to 6.6% in June 2018.
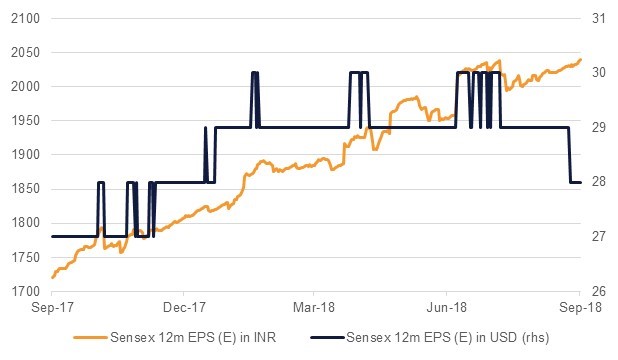
As rates and currency pressure come to fore, consensus estimates for corporate earnings have been lowered by c.1% over the past month. The aggregate FY 2019 earnings per share for Nifty is currently projected at INR 560, reflecting a y/y growth of 25%. However, we note that the high frequency data indicate that the economic activity is moderating slightly and that in our opinion suggests that the current estimates look a tad optimistic.

It is interesting to note that while in INR terms, consensus estimates are near record levels, the projection are at their lowest level this year when measured against the USD. This effectively negates the gains for foreign investors.
The spike in concern over macroeconomic stability coupled with negative corporate news flow resulted in a broad based correction in equity markets over the past month. While in INR terms equities are still in positive territory for the year, the sharp depreciation in USDINR has wiped out those gains in USD terms. The Nifty index has gained +2.3% 3m and +4.6% ytd but dropped -3.7% 3m and -7.8% ytd in USD terms. Relative to broad emerging markets, return from Indian equities is marginally better. The MSCI EM index has dropped -10.1% ytd. Volatility jumped sharply with the INVIXN index jumping +35.2% 3m.
While the drop in broad index is still contained, midcap stocks have seen far deeper correction. The Nifty Midcap 50 index has declined -15.0% ytd in INR terms.
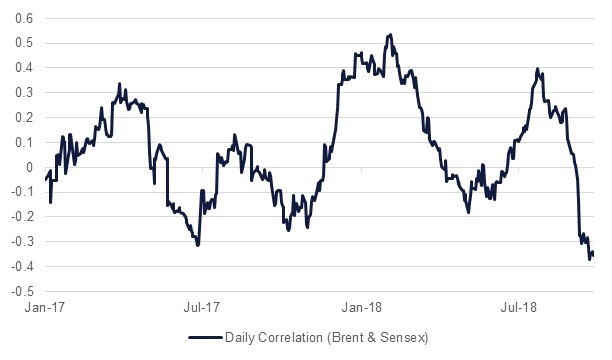
As we look at reasons behind the sharp correction, it is worth pointing out that the negative correlation between Brent prices and Sensex is at its highest in last two years. Oil prices, above USD 65/bbl, generally considered negative for India’s macroeconomic indicators and it is no surprise then to see crude prices rigidly staying above USD 75/bbl weighing on investor sentiment.

The sectoral performance over the last three months reflects the trends in wider economy. Unsurprisingly, technology and healthcare stocks were the best performers with gains of +18.1% 3m and +11.6% 3m as they stand to benefit the most from the decline in the INR. Companies in both these sectors earn a significant part of their revenues in USD. Financials underperformed with losses of -6.7% 3m as concerns over corporate governance in private sector banks and stress in non-banking finance companies surfaced.
The fund flow from foreign institutional investors (FIIs) showed an interesting trend. While the correction in equity prices deepened, outflows from FIIs actually slowed. In the current quarter (Q2 FY 2019), foreign investors have sold stocks worth USD 634mn compared to USD 2.75bn in the previous quarter (Q1 FY 2019). The trend was similar in debt flows. FIIs sold debt worth USD 675mn in the current quarter compared to USD 6.3bn in the previous quarter.
The INR is among the worst performing emerging market currencies so far in 2018. USDINR has lost c.12% ytd to trade at record lows. If sustained, this would be its biggest single-year loss since 2011. In contrast, the JP Morgan EM FX index has dropped -11.0% ytd. The quantum and pace of decline has been deeper than anticipated by us at the start of the year. We had projected USDINR weakness to peak around 68.0 level. However, the combination of stickier gain in oil prices, broad pressure on emerging markets and strength in the USD has led to a significant correction.
While most domestic macroeconomic indicators remain strong, the visible impact of high oil prices on the current account and fiscal deficit is weighing on investor sentiment. This coupled with heavy election calendar over the next three months and an escalating trade war between the US and China is likely to keep volatility in the INR at elevated levels in the short term. While the government has announced some interim measures, they have rightly refrained from intervening directly in markets.
Contrary to common perception, we do not ascribe the fall in the INR akin to India becoming an unfavorable destination for foreign investors. If we look at the 5 year CDS, a commonly considered proxy for country risk, we note that India’s CDS has only widened 35 bps since the start of the year. This is relative to 50 bps widening in 5y CDS of Indonesia and 38 bps in 5y CDS of Malaysia. Both the Indonesia Rupiah (-10.0% ytd) and Malaysian Ringgit (-2.2% ytd) have outperformed the INR year to date.
We have understandably revised our forecasts. We now expect USDINR to end the year around 71.0 levels. Our forecast reflects our view that oil prices will not extend gains much beyond USD 80/bbl, favorable results for the incumbent in elections and limited room for the USD to rise further. We also take comfort in slowing portfolio outflows and note that current levels of USDINR could actually attract some additional flows. However, we concede that situation remains fluid and a contrary move in any of these factors could have an outsized impact on USDINR.