Recent Search
Popular Searches

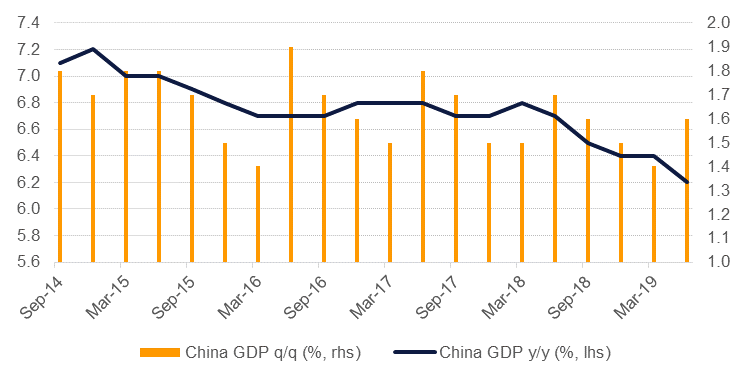
China’s economy expanded by 6.2% year/year in Q2, its slowest pace of growth in almost three decades as the impact of a US-China trade war weighs on the economy and domestic growth slows. The headline number was largely inline market expectations and China’s authorities will ensure that growth rates do not fall signification out of their target range. On a q/q basis growth actually managed to accelerate to 1.6%. Beyond the headline figures, industrial production improved in its June print to 6.3% y/y while fixed asset investment also ticked up slightly to 5.8% y/y. Retail sales improved considerably, gaining by almost 10% y/y for June. Trade data released last week pointed to the softness in the external sector with exports falling by 1.3% y/y in June while imports fell by 7.3%.
Core consumer prices in the US rose by 0.3% m/m in June, helping to take the annual level to 2.1%. Inflation in the US has been rising modestly thanks to higher used vehicle prices but a pick-up in clothing prices as well. Producer prices also ticked up in June, rising 0.1% m/m, but input costs do not yet appear to reflect the impact of tariffs on Chinese goods. Despite the general improvement in inflation, markets are still largely pricing in a rate cut this month, seemingly endorsed by Fed chair Jerome Powell’s dovish commentary to Congress last week.
CPI in India hit an eight-month high of 3.18% y/y for June, an acceleration from a month earlier. Food inflation was behind much of the monthly increase. Industrial production in India rose in May by 3.1% y/y according to the country’s IP index. IP has been improving on last year’s levels with the fiscal year-to-date gains at 3.7%. Nevertheless, Indian industrial companies have been vocal in campaigning the government for some protection as the country has been affected directly by the US and also caught up in the US-China trade conflict.
The Central Bank of Egypt (CBE) kept its benchmark interest rate unchanged at its July 11 meeting, as was widely anticipated, and we forecast that policy will remain static at the August 22 meeting. However, the likelihood that the bank resumes its rate-cutting cycle in September, rather than November as we had previously projected, is now higher given the lower-than-expected inflation print in June. Once the effect of the latest round of subsidy cuts, introduced in July, can be seen, it will be easier to gauge when rate-cutting might resume, but whether it begins in September or November, we maintain our outlook for 200bps of cuts over the remainder of the year.
 Source: Eikon, Emirates NBD Research
Stronger than expected inflation data amid increasing expectations of a rate cut later this month caused the US treasuries yield curve to steepen last week. Yields on 2yr, 5yr, 10yr and 30yrs USTs closed the week at 1.85% (-4bps), 1.87% (+2bps), 2.12% (+7bps) and 2.65% (+12bps) respectively. Sovereign bonds across the pond also closed lower with yield on 10yr Gilts increasing 12bps to 0.83% and that on 10yr Bunds increasing 15bps to -0.21%.
Against this backdrop, GCC bonds had a soft week as yields rose in sync with rising benchmark UST yields. Average yield on Bloomberg Barclays GCC bond index increased 3bps to 3.53% even though average credit spreads declined 2bps to 154bps on the back of nearly 4% increase in oil prices to over USD 66 / b.
In the primary market, BBB+/Baa1 rated DP World priced 10yr, Reg S, USD 1 billion sukuk at MS+195bps, circa 35bps tighter than the IPT and against an order book of over USD 4.6 billion. It also raised another USD 300 million by tapping on existing DPWDU 48s at 4.90% i.e MS+195bps.
A 0.23% rise over the last five days saw EURUSD close the week at 1.1270. Over the course of the week the price was able to break above the 50-day and 100-day moving averages (1.12542 and 1.1255 respectively). These former resistance levels are now providing support. In the week ahead, a break of the 23.6% one-year Fibonacci retracement (1.1274) has the potential to trigger a larger move towards 1.1350, with the chances of this increasing while the price remains above the 100-day moving average.
Over the last week, USDJPY fell by 0.51% to close at 107.91. Despite gaining ground at the start of the week, further gains were capped by the 50-day moving average (108.79) a level which has provided resistance since 3rd May 2019. In addition to this, for a second week, the price closed below the 38.2% one year Fibonacci retracement (108.57). As a result of this bearish indicator, we believe that the path of least resistance is for USDJPY to realize further declines in the week ahead. Inspection of the 14-day RSI shows the indicator is at 42.594 and bearish in momentum which increases the potential risk of further declines.
Growing expectation of a Fed rate cut helped to support US equities last week as the S&P 500 added a second week of gains, up 0.78%. In Europe, performance was more mixed with the FTSE slipping by 0.6% over the week and the Dax down almost 2% despite more assurances from ECB officials that dovish policy is coming.
Regional markets started the week positively with the DFM up 0.7%, the Tadawul adding 0.5% and the ADX roughly flat yesterday.
Oil markets were boosted by disruptions to supply in the Gulf of Mexico as Tropical Storm Barry shuts-in 1.1m b/d of production and persistent concerns over geopolitical risks in the Middle East kept security of supply in focus. Brent futures ended the week up 3.9% at USD 66.72/b while WTI gained 4.7% to finish the week at USD 60.21/b. For reference our Q3 forecasts for average prices in Brent and WTI are USD 67.50/b and USD 60/b respectively.
Products markets look to be making the most of crude prices held in their current ranges as margins for gasoline and fuel oil have jumped to start Q3. Headline refining margins for gasoline in Singapore are at their highest level since April this year while fuel oil cracks are firmly in positive territory. New, lower sulphur fuel oil is being marketed by refiners as they curtail production of higher sulphur grades ahead of the introduction of IMO 2020 rules next year. Risks to Gulf supplies will also support fuel oil margins in the short term. This near-term surge at the bottom of the barrel may persist as the market settles on new benchmarks for fuel oil prices.
China industrial data revelated the country processed 13.07m b/d in June, a new record level. New refineries in China are helping to maintain the pace of growth in refinery processing although much of the products are being exported. Total crude production in China was up 0.8% in the first half compared with a year earlier, a modest turnaround from three years in a row of declining output.
 Edward Bell


